

Self-hosted Version RequirementAccess to alerts requires Helm chart version 0.10.3 or later.
Overview
Effective observability in LLM applications requires proactive detection of failures, performance degradations, and regressions. LangSmith’s alerts feature helps identify critical issues such as:- API rate limit violations from model providers
- Latency increases for your application
- Application changes that affect feedback scores reflecting end-user experience
Configuring an alert
Step 1: Navigate to create alert
First navigate to the Tracing project that you would like to configure alerts for. Click the Alerts icon on the top right hand corner of the page to view existing alerts for that project and set up a new alert.Step 2: Select metric type
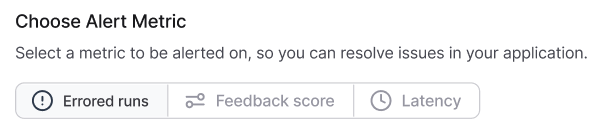
| Metric Type | Description | Use Case |
|---|---|---|
| Errored Runs | Track runs with an error status | Monitors for failures in an application. |
| Feedback Score | Measures the average feedback score | Track feedback from end users or online evaluation results to alert on regressions. |
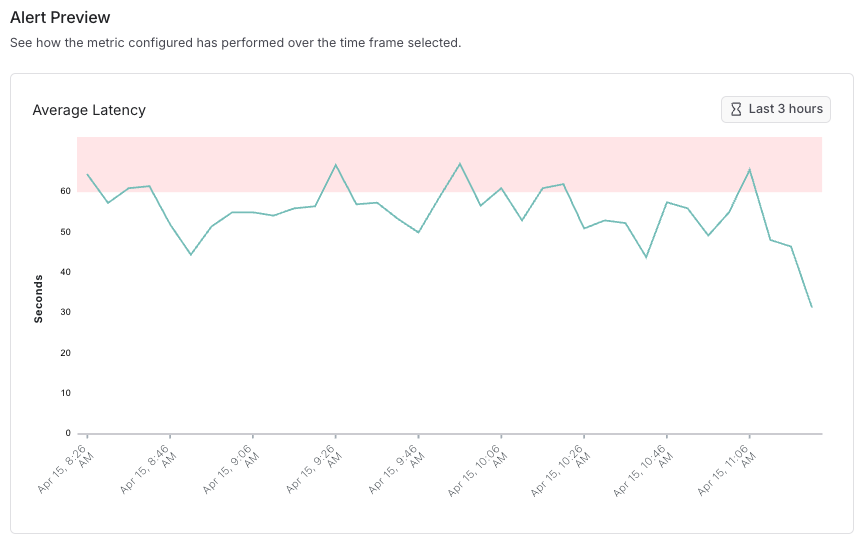
| Latency | Measures average run execution time | Tracks the latency of your application to alert on spikes and performance bottlenecks. |
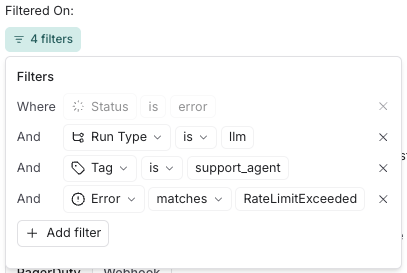
llm runs tagged with support_agent that encounter a RateLimitExceeded error.
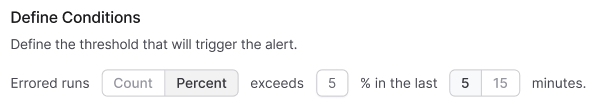
Step 2: Define alert conditions
Alert conditions consist of several components:- Aggregation Method: Average, Percentage, or Count
- Comparison Operator:
>=,<=, or exceeds threshold - Threshold Value: Numerical value triggering the alert
- Aggregation Window: Time period for metric calculation (currently choose between 5 or 15 minutes)
- Feedback Key (Feedback Score alerts only): Specific feedback metric to monitor
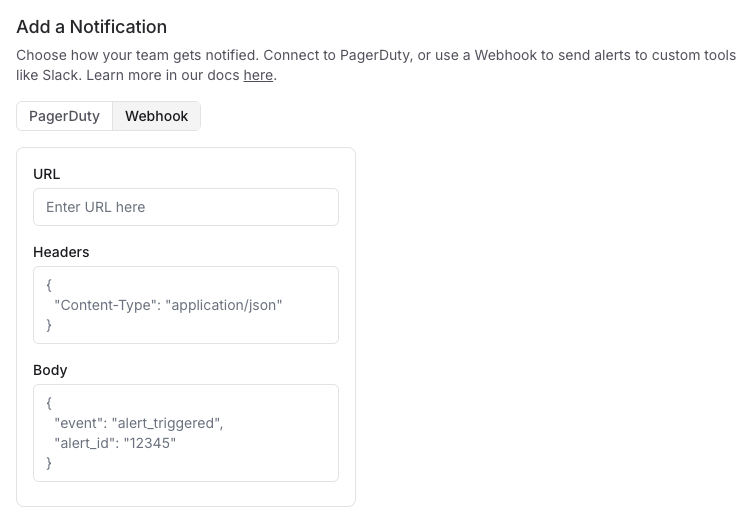
Step 3: Configure notification channel
- PagerDuty
- Webhook
Configure PagerDuty as a notification channel using PagerDuty’s Events API v2. This integration allows critical LLM application issues to trigger PagerDuty incidents, enabling rapid response through your established incident management workflow.Prerequisites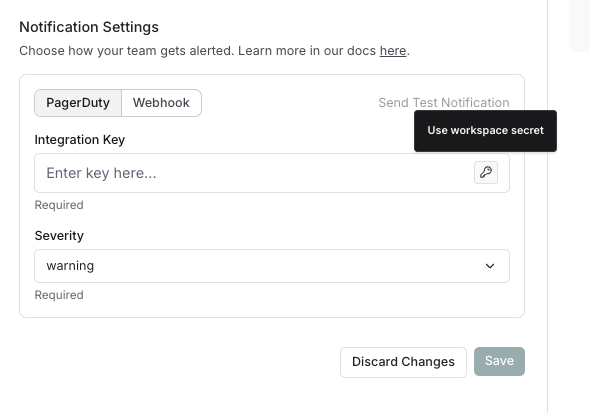
- An active PagerDuty account with administrator access
- Appropriate service-level permissions in PagerDuty
1. Create a Service in PagerDuty
- Log in to your PagerDuty account
- Navigate to Services → Service Directory
- Click + New Service
- Complete the following fields:
- Name: Provide a descriptive name (e.g., “LangSmith Monitoring”)
- Description: Add details about the monitored application
- Escalation Policy: Select the appropriate team escalation policy
- Integration Type: Select “Events API V2”
- Click Add Service to create the service
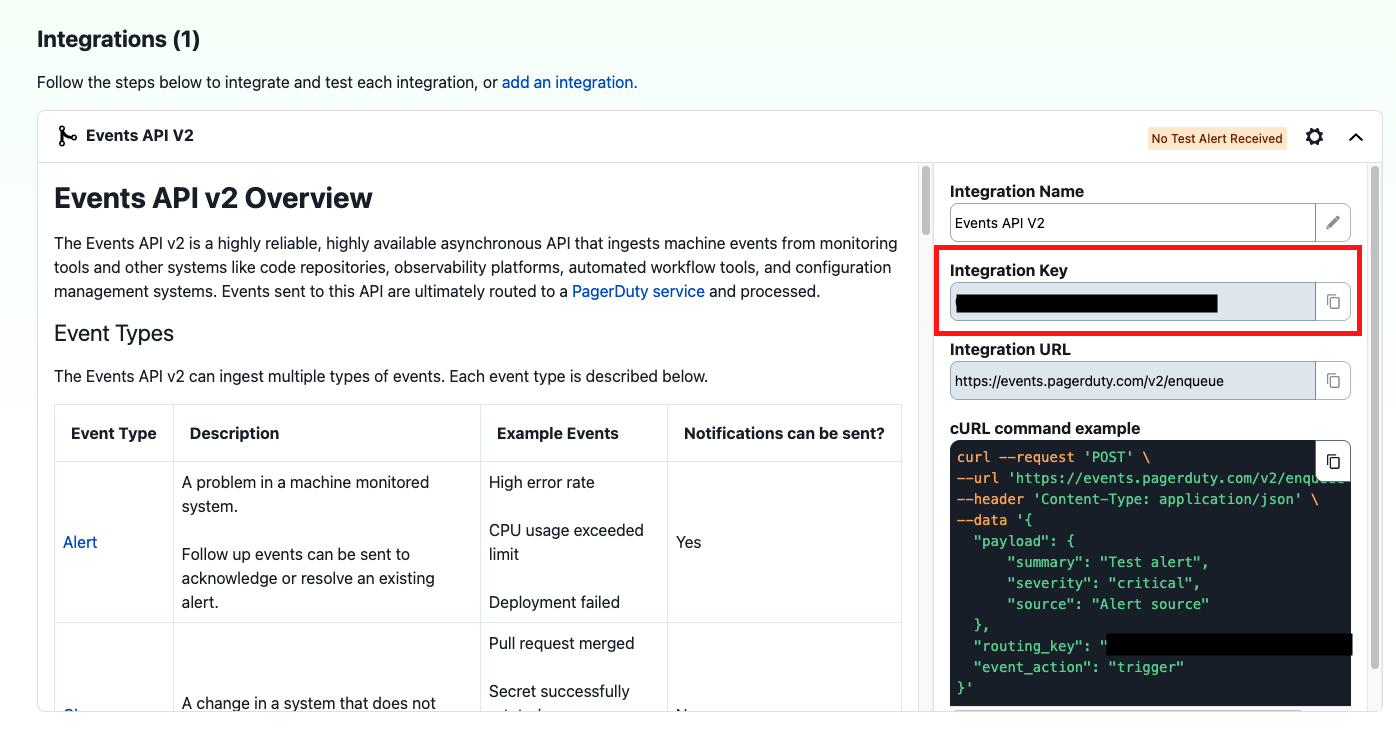
2. Obtain integration key
After creating the service, retrieve the Integration Key:- From the Service Directory, locate and click on your newly created service
- Select the Integrations tab
- Find the “Events API V2” integration
-
Copy the Integration Key (a 32-character alphanumeric string)
3. Configure LangSmith alert with PagerDuty
To receive the same alert again within an hour of it being triggered, you must resolve the active incident created by the alert in PagerDuty.
- In the notification section of your alert set-up in LangSmith, select PagerDuty
- Click the key icon to save the Integration Key as a Workspace secret or select an existing Workspace secret. As a best practice, we recommend saving the Integration Key as a Workspace Secret rather than adding it directly. This will allow you to re-use the same key across alerts for a workspace.
- Configure additional notification options:
- Severity: Maps to PagerDuty incident priority
- Send a test alert by clicking Send Test Alert
- Verify the incident is triggered by PagerDuty and contains relevant LangSmith alert information
Troubleshooting
If incidents aren’t being created in PagerDuty:- Verify the Integration Key is entered correctly in LangSmith
- Ensure the PagerDuty service is active and not in maintenance mode
- Check that your PagerDuty account has Events API v2 enabled
- If an alert trigger appears to be missing in PagerDuty, check whether the expected trigger occurred within one hour of a previous trigger from the same alert rule, and whether the incident created by the previous alert is still open.
- Review network connectivity if your LangSmith instance is behind a firewall
Additional resources
Best practices
- Adjust sensitivity based on application criticality
- Start with broader thresholds and refine based on observed patterns
- Ensure alert routing reaches appropriate on-call personnel
Connect these docs to Claude, VSCode, and more via MCP for real-time answers.